PSA Pop Report Explained: How to Read Population Data Like an Investor
On this page
The PSA pop report is the single most underused tool in card investing. Most collectors check it once, see a number, and move on. That's a mistake — because population data, when you actually know how to read it, tells you exactly which cards are scarce, which grades are rare, and where the market hasn't caught up yet.
I'm Garp, co-founder of Graded.World, and we built our entire pricing engine around population data. Every number in this guide is real and current — pulled from the same exact GemRate population chains and sold-comp archive (eBay and Fanatics) that power our live market indexes — and it all refreshes monthly. No theory, no mocked-up examples.
What Is a PSA Pop Report?
A PSA pop report (population report) is PSA's database of how many copies of every card it has ever graded, at every grade from PSA 1 (Poor) to PSA 10 (Gem Mint). It's the closest thing to a supply ledger the card market has. Stocks publish shares outstanding; cards have the pop report.
Here is what one actually looks like — not a mock-up, but the real, complete PSA grade pyramid of the most-graded trading card on the planet, from our July 2026 population snapshot:
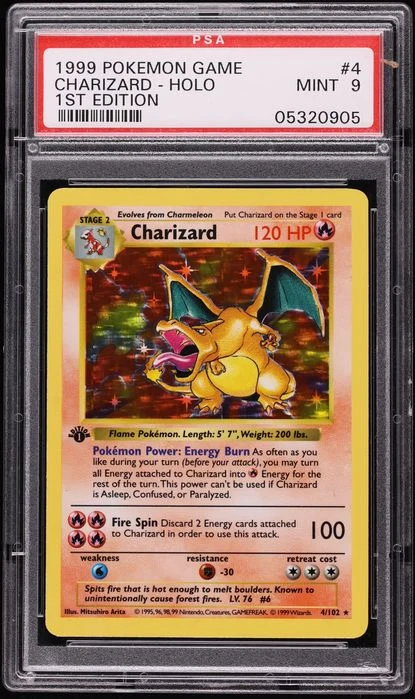
Read that top bar again. 101,739 submissions, and only 487 PSA 10s — a 0.5% gem rate. The bulge sits at PSA 6–8: tens of thousands of played copies from 1999 binders. That shape is why the PSA 10 of a "common" card can be a five-figure trophy while the raw card costs a few hundred dollars:
Real sold comps from Graded's pricing engine · 3 sales (eBay & Fanatics).
View live data on Graded →How Do You Read a PSA Pop Report?
Read four numbers: total population, population at your grade, the higher count, and the gem rate. The pyramid above shows all of them:
Total population is how many copies PSA has ever graded — demand for grading, not scarcity. Population at grade is the supply of the version you'd actually buy. Higher count is how many copies exist above your grade — for a PSA 9 Unlimited Charizard, the higher count is 487, against 8,527 nines. And gem rate is the percentage of all submissions that earned the 10 — the single best measure of how hard a card fights back.
What Is a Good PSA Gem Rate?
Under 10% means real condition scarcity, under 5% condition is a major pricing factor, and under 1% the PSA 10 is a trophy asset — regardless of how many raw copies exist. The formula:
Gem Rate = (PSA 10 Population ÷ Total Population) × 100
Here are the hardest cards to gem among everything we track — real rates, minimum 1,000 grading attempts:
Gem rate = PSA 10s ÷ total PSA gradings. Shorter bar = harder card. Minimum 1,000 grading attempts.
Two cards can have the same PSA 10 population and completely different investment profiles: pop 500 out of 100,000 gradings is a condition-scarcity trophy; pop 500 out of 1,200 gradings is a card nobody grades. The gem rate is what separates them — which is why we surface it across the pop report and every card page.
Can a PSA 9 Be the Top Grade of a Card?
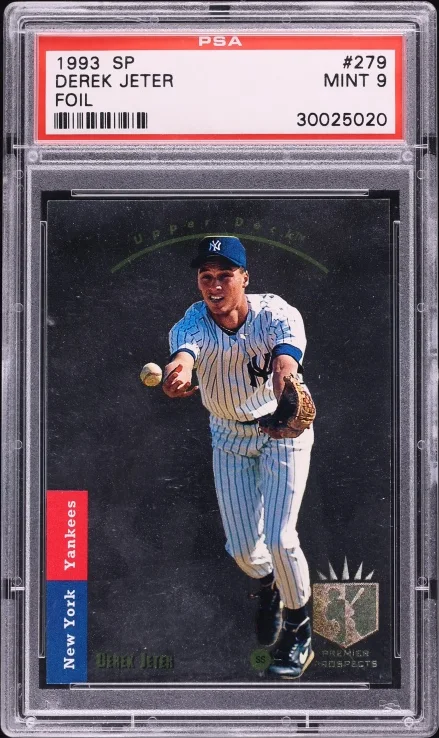
Yes — when almost nothing grades higher, the PSA 9 effectively is the top of the market. Population data isn't a Pokémon thing — here's the most extreme pyramid in our entire dataset, from the sports side. The 1993 SP Foil Derek Jeter rookie is infamous for its foil edges that chip if you look at them wrong:
27,908 gradings. 22 PSA 10s. A 0.08% gem rate. This is the "higher count" lesson in one card: with only 22 copies above it, the PSA 9 — pop 635 — is effectively the top of the market, and it trades like it:
Real sold comps from Graded's pricing engine · 25 sales (eBay & Fanatics).
View live data on Graded →When you evaluate any PSA 9, always check the higher count first. Under 50, the 9 practically is the top-pop card. Over 5,000, the 9 is a commodity waiting to be repriced by every new gem that comes back from Newport Beach.
How Do You Find Undervalued Cards With Pop Data?
Five steps: check the gem rate, compare pop-at-grade to total pop, check the higher count, divide price by population, and track how the population moves.
Step 1: Check the gem rate
Under 10% means condition scarcity is real; under 5% is where it gets interesting. The ladder above is a shopping list as much as a chart.
Step 2: Compare pop-at-grade to total pop
Fossil Unlimited Dragonite: 60 PSA 10s out of 16,181 gradings — a 0.4% gem rate on a card with three decades of demand behind it. That shape (huge base, sliver top) is the profile that repriced Base Set Charizards.
Step 3: Check the higher count
The Jeter above is the template: a PSA 9 with a two-digit higher count is a top-pop asset wearing a 9's label.
Step 4: Cross-reference with fair market value
This is the edge our pricing engine gives you: population and real sold comps on the same screen. The formula worth memorizing:
Scarcity-Price Ratio = PSA 10 FMV ÷ PSA 10 Population
It answers one question: what is the market paying per unit of supply? Run it across real cards and the spread is staggering:
| Card | PSA 10 price | PSA 10 pop | Price per pop unit |
|---|---|---|---|
| 2002 Legendary Collection Reverse Holo Gengar #11 | $408,000 | 12 | $34,000 |
| 1999 Base Set 1st Edition Charizard #4 | $504,000 | 124 | $4,065 |
| 2001 Neo Revelation 1st Edition Ampharos #1 | $5,600 | 10 | $560 |
| 1999 Base Set Unlimited Charizard #4 | $31,200 | 487 | $64 |
The market pays $34,000 per pop unit for the Reverse Gengar and about $4 for the Expedition Poliwrath — a card with a smaller PSA 10 population. That gap is the entire thesis: population is a fact, attention is a variable, and the scarcity map shows every card's position on it.
Step 5: Track population changes over time
Pop reports aren't static — every month, new gems get minted and supply grows. We snapshot the complete grade pyramid of every tracked card monthly; starting with the August market report, we publish the diffs: exactly how many new PSA 10s of each card PSA created that month. A card whose pop is frozen while its price climbs is the strongest setup in the hobby.
What Makes a Low Pop Card Valuable?
Scarcity sets the ceiling, but only demand cashes it in — three kinds of scarcity matter. Absolute scarcity — under 100 PSA 10s of a pre-2000 card is genuinely scarce; the rarest we track is a pop-10 Neo Revelation 1st Edition Ampharos. Relative scarcity — the gem rate matters more than the raw count. Demand-adjusted scarcity — a low-pop card nobody wants is just a low-pop card; the pop-15 Expedition Poliwrath is scarcer than the $408,000 pop-12 Gengar, yet no verified PSA 10 sale of it exists — its gem price is literally undiscovered. Scarcity sets the floor of what's possible; demand decides what actually happens.
The sweet spot for investors
- Iconic character or player (persistent demand)
- Gem rate under 10% (real condition scarcity)
- PSA 10 population under 500 (tight supply ceiling)
- Active sales volume (you can actually exit)
- Rising FMV against a flat pop (demand outrunning supply)
What Are the Most Common Pop Report Mistakes?
Four: counting reholders as new supply, tunnel vision on the PSA 10, chasing low pop without demand, and reading a moving census as a static one.
Mistake #1: Ignoring reholders and crossovers
A card graded twenty years ago may have been reholdered several times, appearing in the pop count each time. For high-value vintage, assume the real population runs 10–20% below the reported number.
Mistake #2: Only looking at PSA 10
For genuinely old cards, the realistic top grade may be an 8 or 9 — the Jeter pyramid above is the proof that a 9 can be the investable top of a market.
Mistake #3: Chasing low pop without demand
Pop 2 sounds thrilling until you check the sales volume. Always read population next to comps — that's the whole design of our card pages.
Mistake #4: Not checking pop trends
A pop-100 card today can be pop-200 next year. Check when the last gem was graded, and watch the monthly supply diffs in the market report.
FAQ
What is a PSA pop report?
A database maintained by PSA tracking how many copies of each card have been graded at every level from 1 to 10 — the supply ledger of the graded-card market.
Is the PSA pop report free?
PSA's own report now sits behind an account login. Graded's pop report is free: exact PSA 10 populations, gem rates, and prices for every tracked WOTC card, refreshed monthly.
How do I read a PSA pop report?
Focus on four numbers: total population, population at your grade, the higher count, and the gem rate. The ratios between them — not any single number — tell you how scarce a card really is in top condition.
What is a good gem rate?
Under 10% is hard, under 5% is genuinely scarce, under 1% is trophy territory. The Base Set Unlimited Charizard gems at 0.5% (487 tens from 101,739 gradings); the 1993 SP Foil Jeter at 0.08%.
Are low pop PSA cards good investments?
Only when scarcity meets demand: an iconic subject, a low gem rate, and real sales volume. Low pop alone guarantees nothing — the market pays $34,000 per pop unit for one pop-12 card and $4 for a scarcer one.
Can pop report numbers go down?
Yes — when cards are reholdered, crossed over to another grader, or when PSA removes counterfeit slabs from the census.
Put it to work: every card on Graded's marketplace shows population next to real sold comps, the free pop report has the full WOTC dataset, and the live indexes reprice all of it daily.